Research Infographics have emerged as a powerful tool in the world of paranormal investigation. They offer a unique way to present complex data and findings in a visually engaging and easily digestible format. Whether you’re exploring EVP analysis, charting UFO sightings, or mapping out haunted locations, a well-crafted infographic can transform your research process and captivate your audience.
Visualizing the Unexplained: Why Research Infographics Matter
In the realm of the paranormal, where skepticism often meets curiosity, presenting compelling evidence is paramount. Research infographics bridge the gap between rigorous investigation and accessible communication. Here’s why they are indispensable for any paranormal researcher:
- Simplified Complexity: Paranormal research often involves intricate data sets, historical timelines, or multifaceted theories. Infographics break down these complexities into easily understandable visuals, making it easier for your audience to grasp the key takeaways.
- Enhanced Engagement: Humans are visual creatures. Our brains process images faster than text, and visuals hold our attention longer. A striking infographic can transform dry data into a captivating story that resonates with your audience.
- Increased Retention: Information presented visually is more likely to be remembered. When you combine data with design, you create a memorable experience that helps your audience retain the information long after they’ve finished reading.
- Boosted Credibility: A well-researched and professionally designed infographic adds credibility to your work. It demonstrates your thoroughness as a researcher and showcases your commitment to presenting information in a clear and concise manner.
 Paranormal Research Infographic Elements
Crafting Compelling Research Infographics: A Step-by-Step Guide
Creating a powerful research infographic requires careful planning and execution. Here’s a step-by-step guide to help you design infographics that captivate and inform:
- Define Your Objective: What story do you want to tell with your infographic? Clearly articulate the main message you want to convey and the specific audience you want to reach.
- Conduct Thorough Research: Gather all the relevant data, statistics, historical facts, and anecdotal evidence that supports your objective. Ensure your sources are credible and accurately cited.
- Choose the Right Visuals: Select visuals that best represent your data and resonate with your audience. This could include charts, graphs, maps, timelines, icons, illustrations, or even photographs of relevant locations or artifacts.
- Structure Your Content: Organize your information logically, using a clear hierarchy of headings, subheadings, and bullet points. Use visuals to break up text and guide the reader’s eye through the information.
- Keep it Concise: Infographics are all about presenting information succinctly. Use clear and concise language, avoiding jargon and technical terms that your audience may not understand.
- Add a Call to Action: Encourage your audience to engage further with your research by including a call to action. This could be as simple as inviting them to visit your website, read a related article, or share the infographic with others.
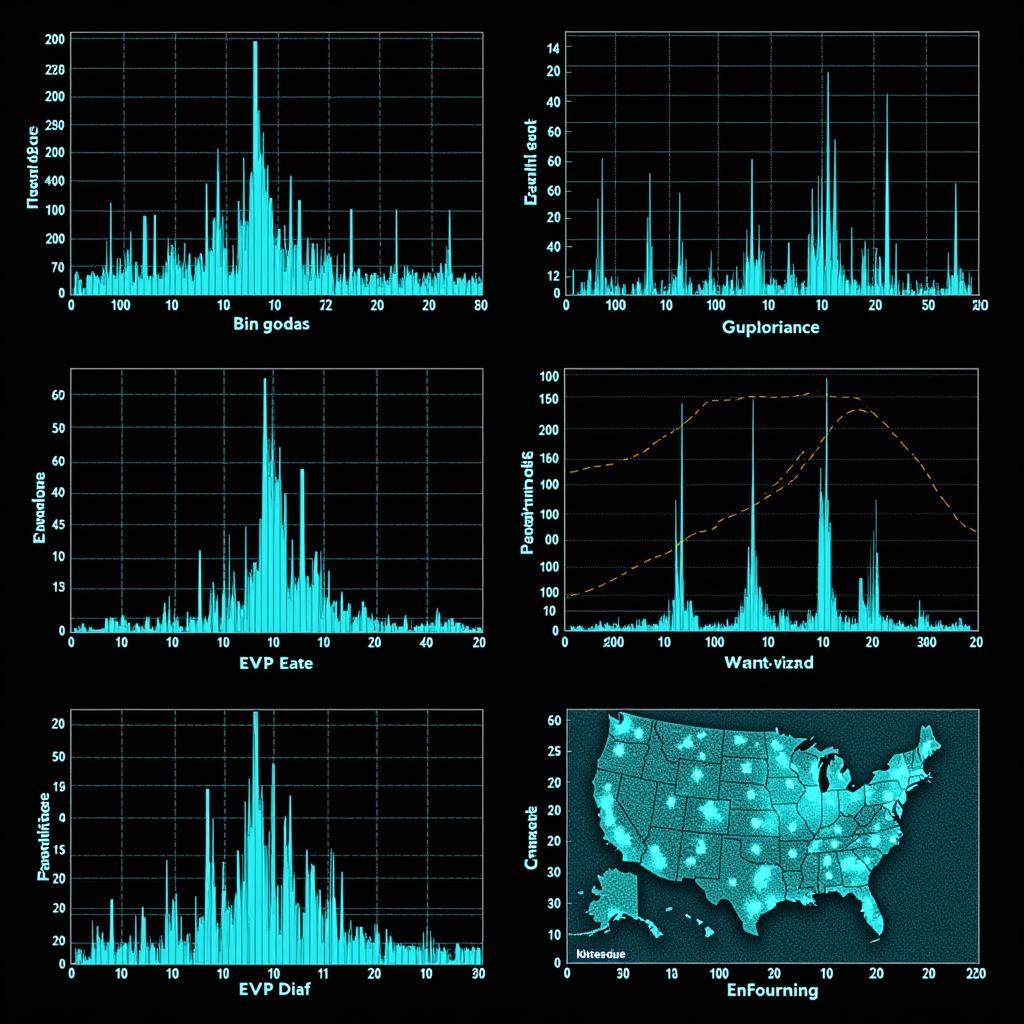 Data Visualization in Paranormal Research
Exploring Different Types of Research Infographics
Depending on the nature of your paranormal research, you can choose from a variety of infographic styles:
- Statistical Infographics: Ideal for presenting data-heavy findings, such as the results of a paranormal survey or the analysis of EVP recordings. Use charts, graphs, and data visualizations to highlight key statistics.
- Timeline Infographics: Effective for illustrating the chronological order of events, such as the history of a haunted location or the evolution of a particular paranormal theory.
- Geographical Infographics: Useful for mapping out locations related to your research, such as UFO sighting clusters, haunted hotspots, or the geographical distribution of paranormal beliefs.
- Process Infographics: Help explain a complex process, such as the steps involved in conducting an EVP session, investigating a haunting, or debunking a paranormal claim.
 Tools and Resources for Creating Research Infographics
Conclusion: Elevating Paranormal Research Through Visual Storytelling
Research infographics are a powerful tool for any paranormal researcher looking to elevate their work and engage a wider audience. By transforming complex data into visually compelling narratives, you can enhance understanding, increase retention, and bolster the credibility of your findings. Embrace the power of visual storytelling and watch your paranormal research come to life.
Frequently Asked Questions About Research Infographics
- What software can I use to create research infographics? Many online tools and software programs are available, ranging from free basic options to more sophisticated paid subscriptions. Canva, Piktochart, and Venngage are popular choices for creating visually appealing infographics.
- How do I choose the right visuals for my infographic? Consider your audience and the type of data you’re presenting. Charts and graphs are suitable for statistical data, while timelines work well for historical information. Maps are ideal for geographical data, and icons and illustrations can add visual interest.
- How do I make my research infographic shareable on social media? Design your infographic with social media sharing in mind. Use standard image sizes and resolutions, and ensure the text is legible even on smaller screens. Include social media sharing buttons directly on the infographic to make it easy for viewers to share.
Explore More Paranormal Research Insights:
- Research process define: Delve deeper into the essential steps involved in conducting rigorous paranormal research.
- Market research case study examples: Discover how market research principles can be applied to paranormal investigations to gather insights and understand trends.
- Headings research paper: Learn how to structure your paranormal research findings effectively using clear and concise headings in a research paper format.
Contact Us
For all your Paranormal Research needs, contact us at:
Phone: 0904826292
Email: research@gmail.com
Address: No. 31, Alley 142/7, P. Phú Viên, Bồ Đề, Long Biên, Hà Nội, Việt Nam.
Our team is available 24/7 to assist you.