Research Graphics are essential tools for paranormal investigators seeking to present compelling evidence and insights into the unknown. Whether you’re analyzing EVP recordings, mapping out haunted locations, or visualizing electromagnetic fluctuations, effective graphics can illuminate the mysteries hidden within data.
Visualizing the Paranormal: Why Research Graphics Matter
In the realm of Paranormal Research, where skepticism often overshadows genuine inquiry, presenting findings in a clear and engaging manner is crucial. Research graphics provide a powerful means of communication, bridging the gap between raw data and meaningful interpretation.
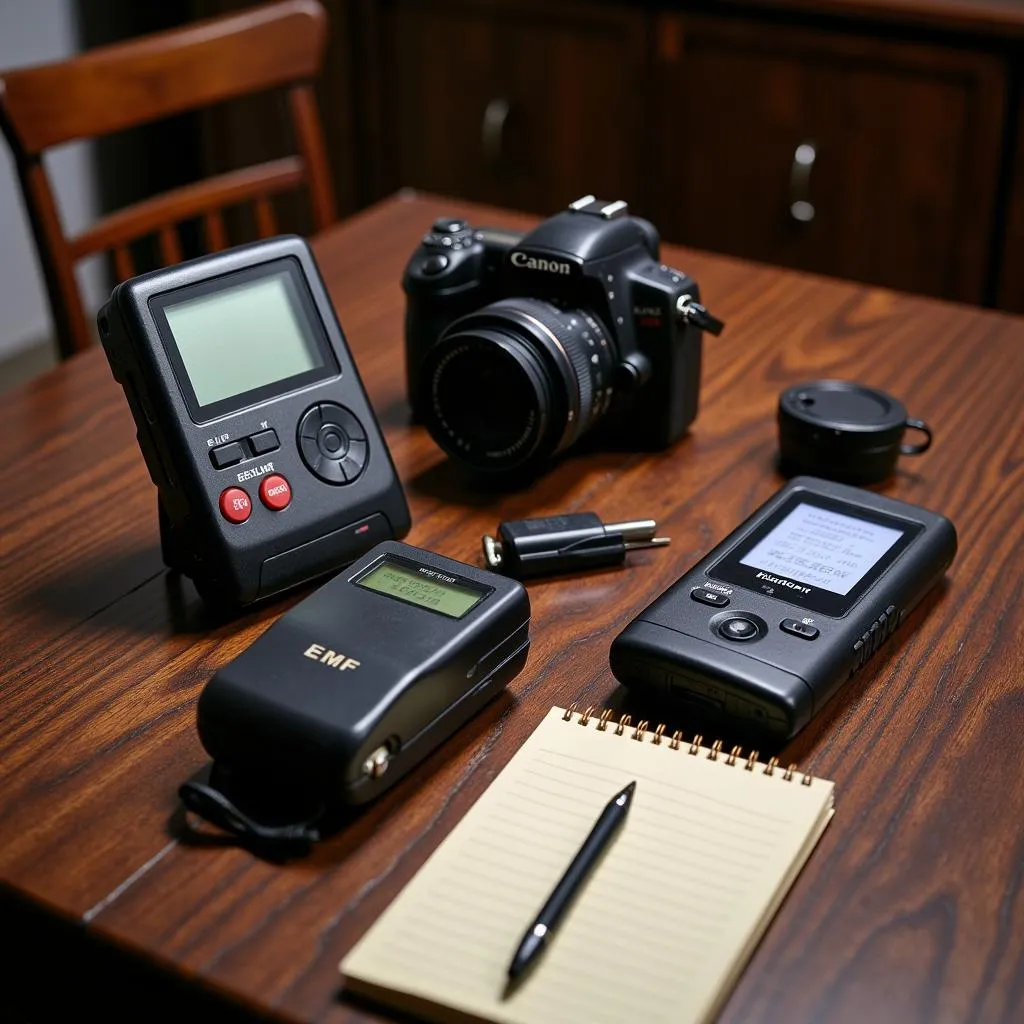 Paranormal investigation equipment laid out on a table
Types of Research Graphics for Paranormal Investigations
Different types of research graphics serve specific purposes in paranormal investigations. Some common examples include:
- Line graphs: Track changes in electromagnetic fields, temperature variations, or other environmental factors over time.
- Scatter plots: Visualize correlations between different data points, such as EVP frequencies and reported apparitions.
- Maps: Pinpoint locations of paranormal activity within a specific area, revealing patterns and hotspots.
- Diagrams: Illustrate the layout of a haunted location, including potential energy pathways or areas of interest.
- Spectrograms: Analyze audio recordings for unusual sound frequencies or patterns associated with EVPs.
 Map showcasing paranormal hotspots in a specific area.
Enhancing Credibility and Understanding
By utilizing research graphics, paranormal investigators can:
- Present data objectively: Visual representations minimize subjective interpretations and allow for unbiased analysis.
- Identify patterns and trends: Graphics make it easier to spot correlations and anomalies within large datasets.
- Communicate findings effectively: Visual aids engage the audience and enhance the comprehension of complex data.
- Strengthen the credibility of research: Well-designed graphics lend a sense of professionalism and rigor to paranormal investigations.
Choosing the Right Graphics for Your Research
The type of research graphic you choose will depend on the nature of your data and the story you want to tell. For example:
- Line graphs are ideal for showing changes in environmental readings over time.
- Scatter plots can help identify potential correlations between different paranormal phenomena.
- Maps are invaluable for visualizing the distribution of paranormal activity in a specific location.
 Open laptop displaying a paranormal investigation report with graphs and charts.
Conclusion
Research graphics are indispensable tools for paranormal investigators seeking to understand the unexplained. By embracing the power of visual communication, we can shed light on the mysteries that lie beyond the veil of our everyday perception. Remember, the key is to select the most appropriate graphics for your data and present your findings in a clear, concise, and compelling manner. Only then can we hope to unravel the intricate tapestry of the paranormal and bring its hidden truths to light.