Quantitative research relies heavily on data analysis methods to transform raw data into meaningful insights. These methods help researchers identify patterns, test hypotheses, and draw conclusions about the relationships between variables. This article delves into the core data analysis methods used in quantitative research, empowering researchers to make sense of their data and derive valuable conclusions.
 Data Analysis in Quantitative Research
Descriptive Statistics: Painting a Clear Picture
Descriptive statistics serve as the foundation of quantitative data analysis. They aim to summarize and describe the main features of a dataset, providing a clear and concise overview of the data’s central tendencies and distributions.
- Measures of Central Tendency: These measures identify the central value around which the data points cluster. Common measures include the mean (average), median (middle value), and mode (most frequent value).
- Measures of Dispersion: These measures quantify the spread or variability of data points. Key measures include range (difference between highest and lowest values), variance (average squared deviation from the mean), and standard deviation (square root of variance).
By employing descriptive statistics, researchers can gain a preliminary understanding of their data, identifying key characteristics and potential outliers. This initial step is crucial in guiding further analysis and interpretation.
Inferential Statistics: Unveiling Hidden Relationships
While descriptive statistics focus on summarizing data, inferential statistics aim to draw conclusions and make predictions about a population based on a sample. These methods employ probability theory to test hypotheses and determine the statistical significance of observed relationships.
- Hypothesis Testing: Researchers formulate a null hypothesis (no effect) and an alternative hypothesis (effect exists). Statistical tests, such as t-tests or ANOVA, are then employed to determine the likelihood of observing the data if the null hypothesis were true. A low p-value (typically less than 0.05) suggests rejecting the null hypothesis in favor of the alternative.
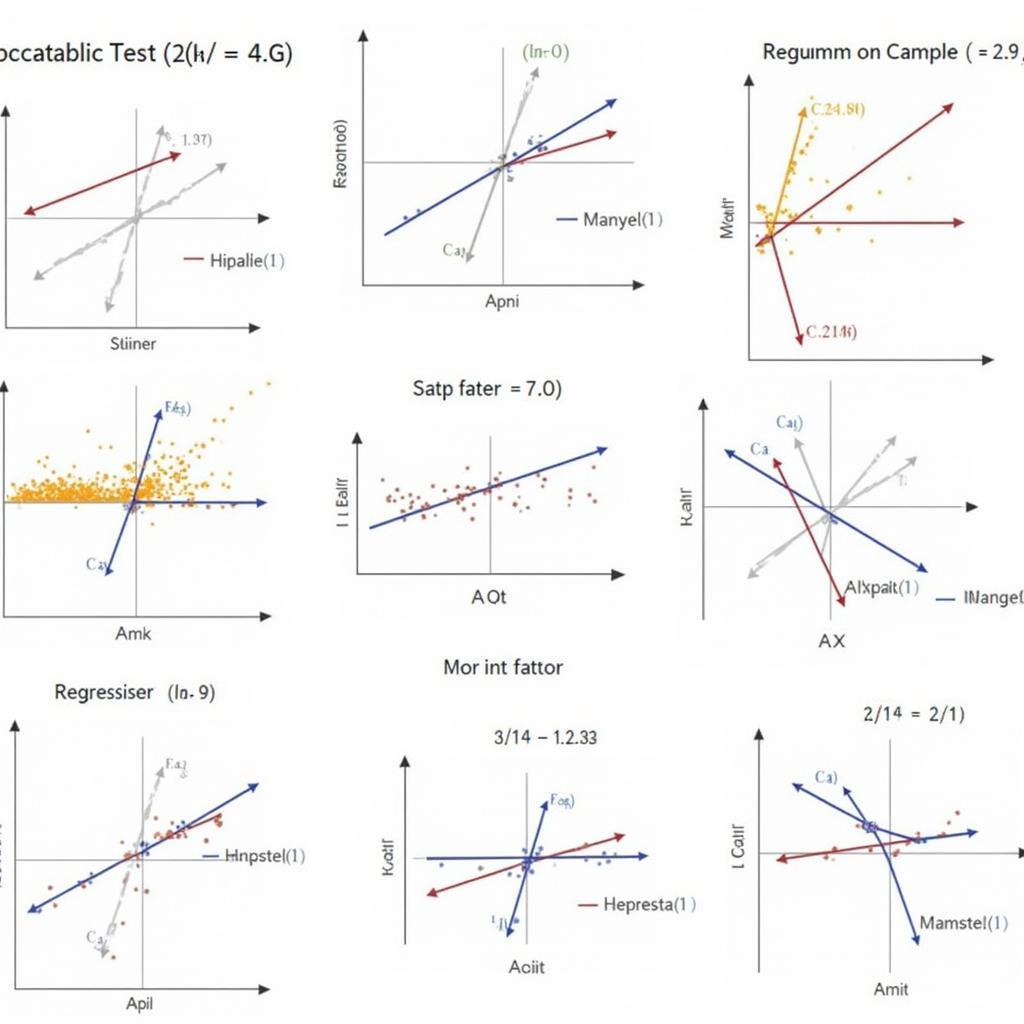
- Correlation and Regression Analysis: These techniques explore the relationships between variables. Correlation analysis measures the strength and direction of the linear association between two variables. Regression analysis, on the other hand, allows for predicting the value of one variable based on the value of another variable.
 Examples of Inferential Statistics in Research
Inferential statistics empower researchers to move beyond mere descriptions and delve into the complexities of causal relationships, making inferences about populations based on the analysis of collected samples.
Choosing the Right Data Analysis Method
Selecting the appropriate data analysis method is crucial for obtaining accurate and meaningful results. The choice depends on several factors:
- Research Questions: The specific research questions being addressed guide the selection of analytical techniques. For instance, exploring relationships between variables might necessitate regression analysis, while comparing groups might call for t-tests or ANOVA.
- Data Types: Different statistical methods are suited for different types of data. Nominal data (categories), ordinal data (ranked categories), interval data (equal intervals), and ratio data (true zero point) each require specific analytical approaches.
- Sample Size: The number of participants or observations in the study influences the choice of statistical tests. Some tests are more robust for small samples, while others require larger sample sizes for reliable results.
The Role of Software in Data Analysis
Statistical software packages have become indispensable tools for quantitative data analysis. Programs like SPSS, R, and SAS provide a comprehensive suite of tools for data manipulation, statistical analysis, and visualization.
- Data Cleaning and Preparation: Software facilitates the cleaning and preparation of data, identifying and handling missing values, outliers, and inconsistencies.
- Performing Statistical Tests: Software packages streamline the process of conducting a wide range of statistical tests, from basic descriptive statistics to complex inferential analyses.
- Visualizing Results: Graphs, charts, and other visualizations generated by software aid in interpreting and communicating findings effectively.
Conclusion
Data analysis methods are essential for unlocking the insights hidden within quantitative data. By employing appropriate descriptive and inferential statistical techniques, researchers can transform raw data into meaningful findings, advancing knowledge and informing decision-making. Understanding the principles and applications of these methods is crucial for anyone involved in quantitative research.
For researchers seeking to delve deeper into specific research methodologies, our articles on escalent research legit, gatech operations research, and what is an approach in research provide valuable perspectives.
Remember, the journey from data to knowledge begins with selecting the right data analysis methods and leveraging the power of statistical software. By embracing these tools, researchers can confidently navigate the complexities of data and unearth valuable insights that drive progress in their respective fields.