The results section of a research paper is where the magic happens. After weeks, months, or even years of meticulous research, this is where you finally get to unveil your findings to the world. It’s the heart of your paper, showcasing the fruits of your labor and providing concrete evidence to support your claims. But presenting your results effectively is just as crucial as obtaining them. A well-structured and clearly articulated results section can mean the difference between a groundbreaking discovery and a dismissed hypothesis.
Deciphering the Data: What Should Be Included?
The results section should be a clear, concise, and objective presentation of your findings. It’s not the place for interpretations or drawing conclusions – that comes later in the discussion section. Instead, focus on:
- Summarizing your data: Begin by presenting the key findings that directly answer your research question.
- Using visuals: Tables, charts, and graphs are your allies. They can make complex data more digestible and visually appealing.
- Reporting statistical analyses: If you used statistical methods, present the results clearly, including p-values, confidence intervals, and effect sizes.
- Maintaining objectivity: Stick to the facts. Avoid subjective interpretations or drawing conclusions at this stage.
A Glimpse into the Paranormal: An Example
Let’s say you’re a computer and research scientist investigating whether electromagnetic fluctuations correlate with reported ghost sightings. Your results section might look something like this:
Electromagnetic Fluctuations and Reported Sightings
Table 1: Correlation between Electromagnetic Fluctuations and Reported Ghost Sightings
| Location | Reported Sightings (per month) | Average EM Fluctuation (mG) |
|---|---|---|
| Abandoned Hospital | 12 | 15.2 |
| Old Library | 6 | 8.9 |
| Historical Cemetery | 9 | 11.7 |
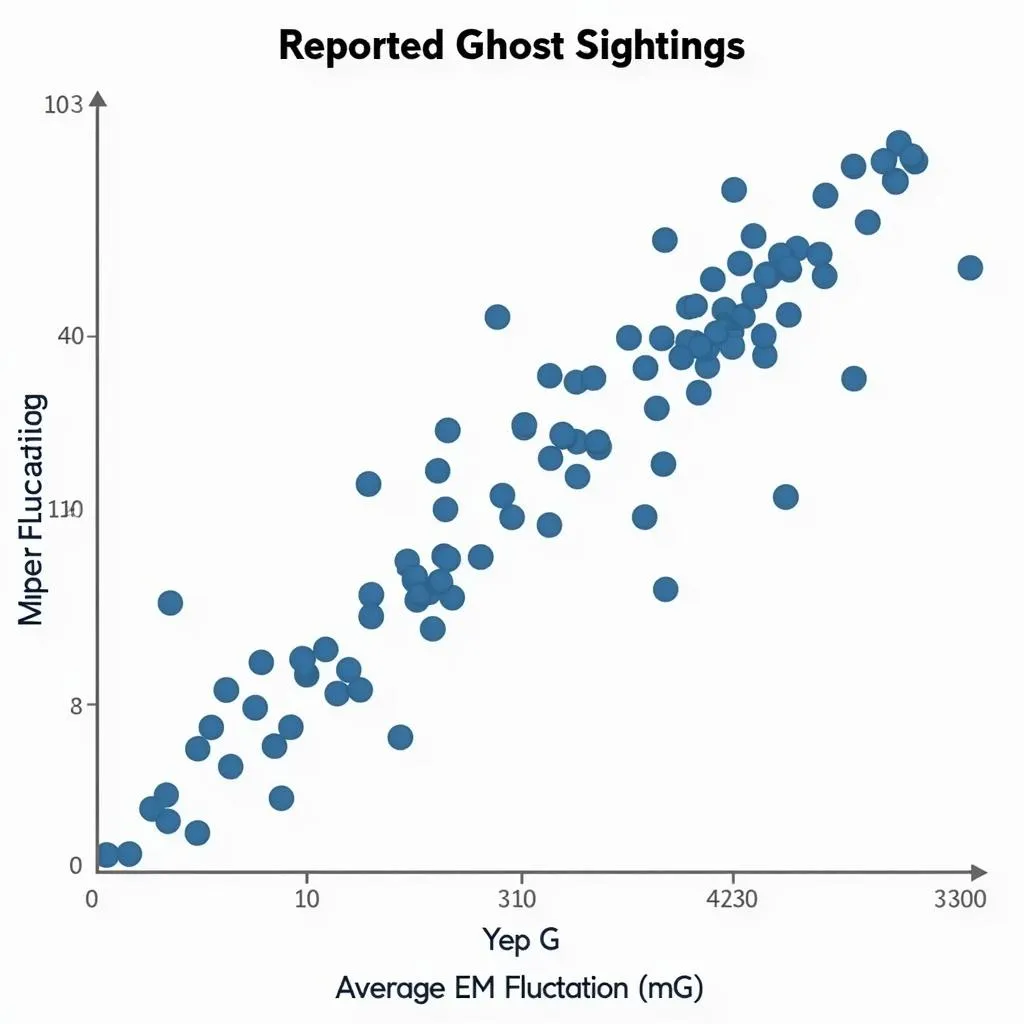
Figure 1: Scatterplot Showing the Relationship Between EM Fluctuations and Sightings
 Scatterplot of EM Fluctuations and Ghost Sightings
A Pearson correlation analysis revealed a statistically significant positive correlation between the number of reported ghost sightings and the average electromagnetic fluctuation at each location (r = .92, p < .01).
Avoiding Common Pitfalls
Here are a few things to steer clear of when crafting your results section:
- Don’t repeat your methodology: The methods section already detailed your procedures.
- Don’t cherry-pick data: Present all relevant findings, even those that contradict your hypothesis.
- Don’t over-interpret: Save in-depth analysis for the discussion section.
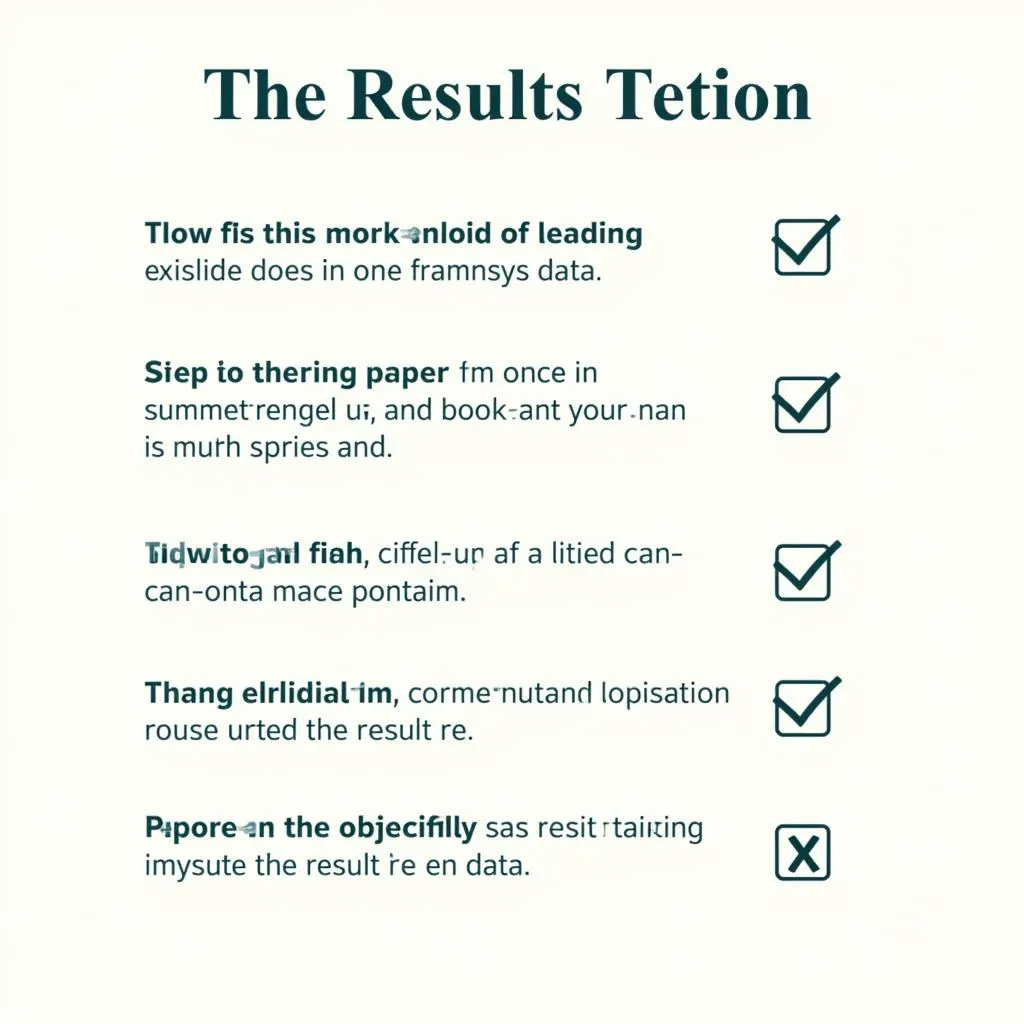
 Results Section Checklist
The Power of a Well-Crafted Results Section
Remember, the results section is your opportunity to let the data speak for itself. By presenting your findings clearly and objectively, you lay the foundation for a compelling discussion and ultimately contribute to the ever-evolving body of knowledge in your field. Whether you’re investigating the paranormal or exploring the depths of the cosmos, a well-structured results section is paramount to sharing your discoveries with the world.
Frequently Asked Questions about Results Sections
1. What is the difference between results and discussion sections?
The results section presents your findings objectively, while the discussion section interprets those findings and relates them to the existing literature.
2. Can I include my opinion in the results section?
No, the results section should be entirely objective. Save your interpretations for the discussion section.
3. How much detail should I include in my results section?
Provide enough detail so that readers can understand your findings but avoid overwhelming them with unnecessary information.
4. What if my results don’t support my hypothesis?
That’s perfectly fine! Negative results are still valuable and should be reported honestly.
5. Can I use visuals in my results section?
Absolutely! Visual aids like tables, charts, and graphs are highly encouraged as they make data easier to understand.
Need Help with Your Research?
Contact us at Phone Number: 0904826292, Email: research@gmail.com or visit us at No. 31, Alley 142/7, P. Phú Viên, Bồ Đề, Long Biên, Hà Nội, Việt Nam. We have a 24/7 customer support team ready to assist you.
Explore further:
- For a deeper dive into identifying research questions, check out our article on how to identify a research question in an article.